Category Archives: Project System Tools

Small Project System Tools Update

We pushed out a small update to Project System Tools today that shifts the way that binary logs are opened in Visual Studio. In previous versions, all binary logs opened into a single window. The original idea was to enable analysis across multiple logs at once, but it’s become apparent that it’s usually going to be more useful to open one log at a time. As a result, with this new update, binary logs will open into individual editors of their own.

This also allows us to add more views to the binary log window, and so we’ve added tabs to show summaries of the targets, tasks, and evaluations (if recorded) that can be useful to take a more performance-oriented look at the profile.

Log loading should also be a bit more robust in the situations where not all of the MSBuild information is recorded in the log. (In the past, the log would just fail to open.)

You can also follow me on Twitter here.

View Evaluation Profiles in Project System Tools

We pushed out a small update to Project System Tools last week that adds the ability to view evaluation profiles that are stored in a binlog file. Unfortunately, at the moment we can’t collect evaluation profiles within Visual Studio due to the lack of an API to turn it on (working on that RSN), so you have to use the command-line MSBuild to gather that information using the /profileevaluation switch.

I’ll try to write up a little more later about how to use evaluation profiles to find problems in your project. We’ve already used it to find several cases where globbing (i.e. wildcards) in a project caused repeated wildcard expansion that bottlenecked project load. So it can be very useful.

(We also added to the properties of targets in the viewer a Reason property that will tell you whether a target was run because of a BeforeTargets, AfterTargets, or DependsOn.)

You can also follow me on Twitter here.

Project System Tools: Now With Binary Log Viewing!

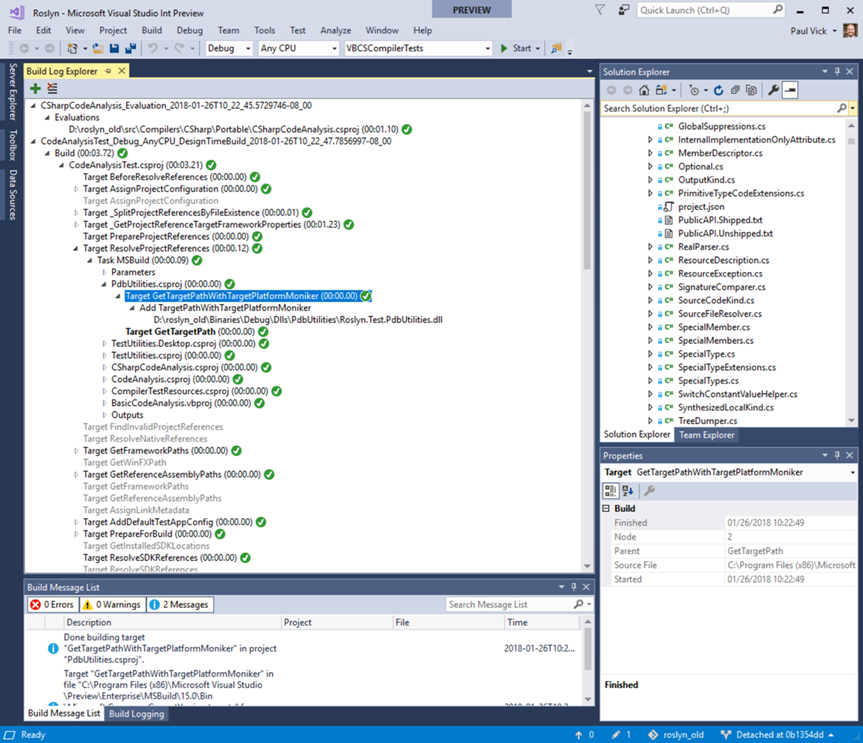
There has been a lot of positive response to the Project System Tools extension, and we’re starting to see people turn to it to help diagnose design-time build (and other build) issues. One of the limitations of the extension has been the fact that once a build log has been captured, there was no native way to look at the log in Visual Studio. Either you had to run it through MSBuild to get a text log, or you had to install Kirill’s excellent MSBuild Log Viewer. To address this limitation, we’re releasing a new version of the project system tools that integrates a Build Log Explorer window:

Once you’ve updated the extension, you can find the viewer at View > Other Windows > Build Log Explorer. The window should be fairly self-explanatory—the Add toolbar button will let you add one or more .binlog files into the explorer, or you can double-click on a log in the Build Logging tool window to add it to the explorer window. (We opted for a multi-log window to allow for the future ability to analyze across multiple build logs.) You will likely also want to show the View > Other Windows > Build Message List window, as that will show any MSBuild messages associated with the selected node in the explorer window. You’ll also note that the Properties window will show properties of the selected node in the explorer window (for example, clicking on a project build node will show the environment used to build the project in the properties window).

The Build Log Explorer window used Kirill’s code as a starting point but has diverged significantly in several ways:

  • The Build Log Explorer uses a standalone read-only build log object model as its underlying data model (Microsoft.VisualStudio.ProjectSystem.LogModel.dll), which will make it easier to build command-line log analysis tools (since it only depends on MSBuild and nothing else).
  • The Build Log Explorer window shows execution times and success/failure directly in the tree.
  • Targets are listed in execution order rather than arranged as a tree since targets aren’t executed in a strict hierarchical order (instead you have before/depends/after targets).
  • Targets that were the requested targets in a build are bolded.
  • Dependent builds are listed under the MSBuild task that invokes them, which makes it easier to follow the order of build.

Give it a try and let us know what you think!

You can also follow me on Twitter here.

Project Evaluations Count Too!

In my last couple of blog posts, I talked about the role that design-time builds play in Visual Studio performance. However, they are not the only way in which your project file can affect the IDE.

Before Visual Studio can do anything with your project (much less run a design-time build on it), we first have to load the project from its XML format and interpret that XML to create the in-memory representation of the project. But the MSBuild format isn’t purely static–you can specify conditions inside of the project file that governs whether other target files are imported, whether properties are set or not set, or whether items are included or not included in the build. So as MSBuild interprets the XML, it has to evaluate all those conditions to figure out what is really in the project.

And Visual Studio doesn’t only interpret your project when you open a solution, it often has to do this other times as well. For example, since a lot of things in a project file are conditioned on what build configuration (Debug vs. Retail) or platform you are building for, when you switch build configurations or platform Visual Studio may need to reevaluate the project. Or, for another example, if a project references a NuGet package that adds target files of its own, the project may need to be re-evaluated when that package is updated, in case something changed in those included target files.

Unfortunately, these evaluations aren’t necessarily free. Depending on the complexity of your project file, or of the target files it includes, it may take a little while to evaluate your entire project file. While this time is less noticeable than design-time builds in general, if you open a solution with a large number of projects it can really add up. And, unlike design-time builds, there is no cache that Visual Studio maintains of project evaluation results, so you pay the cost every time you open a project (or do something that forces a re-evaluation).

We’re thinking about ways to make this better, but in the interim we’ve been enhancing the Project System Tools extension to help users better understand the impact of evaluations. So now the Build Logging window will include evaluations as well as design-time (and regular) builds:

Right now evaluation logging only works for non-SDK projects (i.e. non-.NET Standard and non-.NET core projects) due to API limitations, but we hope to have it working for all projects very soon.

(You can also try out an experimental MSBuild evaluation profiler that’s currently sitting in a branch of MSBuild. We’re looking at moving that into the product in the near future as well.)

You can also follow me on Twitter here.
Getting Visibility into Design-Time Builds

In my last blog post, I talked about design-time builds and why you should care about them. But one of the biggest problems with design-time builds is that they are invisible. They run in the background and you don’t get any feedback that anything is going on (except, maybe, that Visual Studio seems to be a bit slower while they run). And if they fail, there’s no way to determine that that happened and no way to determine what went wrong.

To address some of these issues, the project system team has now published a new Visual Studio extension that can help: Project System Tools. This extension is a place where the project system team can add tools that make working with the project system better. The first tool that we’ve added to the extension is the Build Logging tool window. When you pull down the View menu item, under “Other Windows” there will now be a “Build Logging” choice. If you choose that you’ll see a tool window come up:

When you hit the “play” button on the toolbar, the build logging window will start recording build logs for all builds that happen in Visual Studio, including design-time builds! In the window, you’ll be able to see:

  • The project that was built
  • The type of project (csproj, vbproj, etc.)
  • The “dimensions” of the build (x86, AnyCPU, Debug, Release, etc.)
  • The top-level targets that were built
  • Whether the build was a design-time build
  • Start time and elapsed time
  • Whether build succeeded or failed (or is still running, for that matter)

The build logs are saved in the new MSBuild binary log format. If you double-click on a build log entry, we’ll try and open the binlog file using whatever viewer is registered. (I suggest installing Kirill Osenkov’s MSBuild Log Viewer) You can also right-click on the log and save it to a location of your choice, which can be handy for passing around build logs.

One thing to note is that because the Build Logging window depends on new APIs that were added to Visual Studio in the 15.4 release, you will only be able to install the extension on the most up-to-date version of Visual Studio 15 (or one of the Preview builds).

Try it out and let us know what you think! The project system tools are open source, so you can contribute to them if you go to our repo: https://github.com/dotnet/project-system-tools. We also have some more ideas of things to add, so stay tuned!

You can also follow me on Twitter here.