Category Archives: Project System

MSBuildAllProjects Considered Harmful

For a long time now, a standard piece of advice to authors of MSBuild .targets and .props files is to make sure you add your file path to the property $(MSBuildAllProjects). This is because MSBuild checks the paths listed in that property when it wants to determine whether a project file has changed and needs to be rebuilt. So if you wanted projects that use your .targets or .props to be rebuilt when your file is updated or edited, you added your full path to that property.

However, there were three problems with this:

  1. Paths tend to be long and, especially with NuGet in the picture, there are now a lot of .targets and .props files that get mixed into a build. So the $(MSBuildAllProjects) property keeps getting bigger and bigger.
  2. MSBuild keeps around all versions of a property. So not only could the final value of the property be really long, if there were, say 30 files added in one at a time, there are also 30 copies of the property as it is being built up, multiplying the memory cost of the property.
  3. There is one instance of this property for each project in a solution. So if you have a lot of projects in a solution, you’re going to multiply things even further.

The end result was that on some larger solutions we’ve looked at, you end up with a non-trivial percentage of the managed heap devoted to just this one single property. And the thing is that 99% of the time we only really care about one file in that list — the file that was last modified, since that’s what MSBuild is going to check against.

So, starting in 16.0, MSBuild now will automagically prepend the last modified project/.targets/.props file to $(MSBuildAllProjects). So if the only reason you’re adding yourself to that property is to make sure that the project rebuilds when you’re touched and you only need to support 16.0+, you should stop adding yourself. We’re already doing this in our projects, and so should you, to help performance.
Small Project System Tools Update

We pushed out a small update to Project System Tools today that shifts the way that binary logs are opened in Visual Studio. In previous versions, all binary logs opened into a single window. The original idea was to enable analysis across multiple logs at once, but it’s become apparent that it’s usually going to be more useful to open one log at a time. As a result, with this new update, binary logs will open into individual editors of their own.

This also allows us to add more views to the binary log window, and so we’ve added tabs to show summaries of the targets, tasks, and evaluations (if recorded) that can be useful to take a more performance-oriented look at the profile.

Log loading should also be a bit more robust in the situations where not all of the MSBuild information is recorded in the log. (In the past, the log would just fail to open.)

You can also follow me on Twitter here.

Another Way to Talk to the Project Team

If you have issues with your project file or with the project system, you can always ping me or David Kean or other team members on Twitter. However, Twitter is not always the most ideal way to carry on support-type conversations, particularly if there needs to be a lot of back and forth.

As a result, I created a Gitter channel for the dotnet/project-system repo which can be a place to have those more in-depth conversation. I’ll be monitoring the channel and will try and pull in other people as needed if there are questions beyond my expertise. We’ll see if it can develop into a place where people can come to get their C#/VB/F# project questions answered. Hope to see you there!

View Evaluation Profiles in Project System Tools

We pushed out a small update to Project System Tools last week that adds the ability to view evaluation profiles that are stored in a binlog file. Unfortunately, at the moment we can’t collect evaluation profiles within Visual Studio due to the lack of an API to turn it on (working on that RSN), so you have to use the command-line MSBuild to gather that information using the /profileevaluation switch.

I’ll try to write up a little more later about how to use evaluation profiles to find problems in your project. We’ve already used it to find several cases where globbing (i.e. wildcards) in a project caused repeated wildcard expansion that bottlenecked project load. So it can be very useful.

(We also added to the properties of targets in the viewer a Reason property that will tell you whether a target was run because of a BeforeTargets, AfterTargets, or DependsOn.)

You can also follow me on Twitter here.

Project System Tools: Now With Binary Log Viewing!

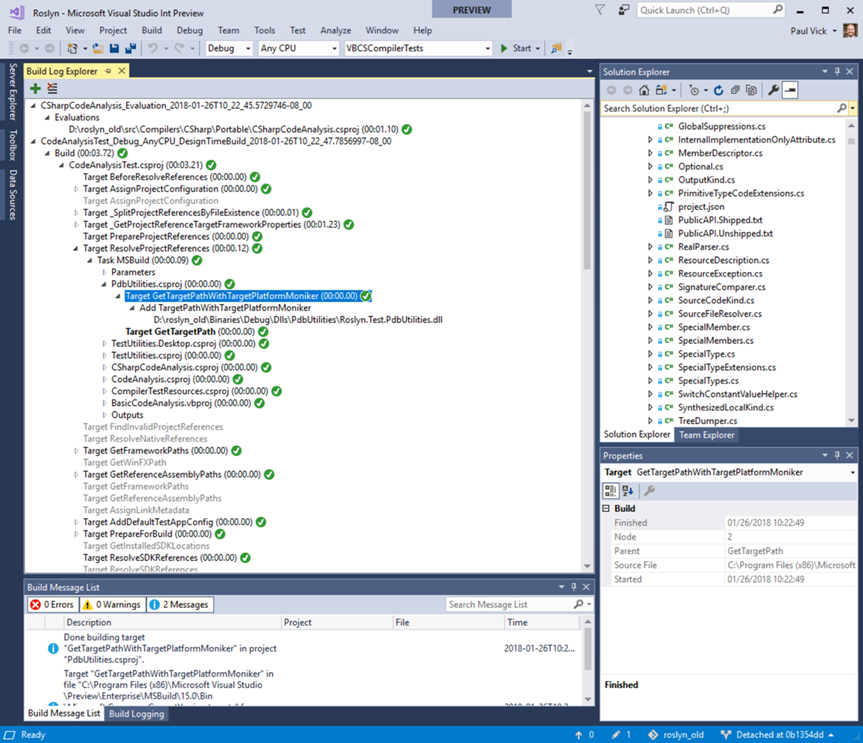
There has been a lot of positive response to the Project System Tools extension, and we’re starting to see people turn to it to help diagnose design-time build (and other build) issues. One of the limitations of the extension has been the fact that once a build log has been captured, there was no native way to look at the log in Visual Studio. Either you had to run it through MSBuild to get a text log, or you had to install Kirill’s excellent MSBuild Log Viewer. To address this limitation, we’re releasing a new version of the project system tools that integrates a Build Log Explorer window:

Once you’ve updated the extension, you can find the viewer at View > Other Windows > Build Log Explorer. The window should be fairly self-explanatory—the Add toolbar button will let you add one or more .binlog files into the explorer, or you can double-click on a log in the Build Logging tool window to add it to the explorer window. (We opted for a multi-log window to allow for the future ability to analyze across multiple build logs.) You will likely also want to show the View > Other Windows > Build Message List window, as that will show any MSBuild messages associated with the selected node in the explorer window. You’ll also note that the Properties window will show properties of the selected node in the explorer window (for example, clicking on a project build node will show the environment used to build the project in the properties window).

The Build Log Explorer window used Kirill’s code as a starting point but has diverged significantly in several ways:

  • The Build Log Explorer uses a standalone read-only build log object model as its underlying data model (Microsoft.VisualStudio.ProjectSystem.LogModel.dll), which will make it easier to build command-line log analysis tools (since it only depends on MSBuild and nothing else).
  • The Build Log Explorer window shows execution times and success/failure directly in the tree.
  • Targets are listed in execution order rather than arranged as a tree since targets aren’t executed in a strict hierarchical order (instead you have before/depends/after targets).
  • Targets that were the requested targets in a build are bolded.
  • Dependent builds are listed under the MSBuild task that invokes them, which makes it easier to follow the order of build.

Give it a try and let us know what you think!

You can also follow me on Twitter here.

Dear Extension Authors: Please Mind the Resolved State of the References!

I’ve been spending a lot of time lately looking at the performance of the Visual Studio project system for C# and VB. And something that’s come up more than a few times now is consumers of the automation interfaces (a.k.a. DTE) accidentally tanking Visual Studio performance when working with project references.

To step back and review for a moment, one of the fundamental jobs the project system has is to run what are called design-time builds to determine the full contents of a project. I talked about it more here, but the short version of the story is that a design-time build is a build that the project system runs in the background that doesn’t actually call the compiler, just captures everything that makes up the build. This information is then (primarily) used to initialize the language service that provides things like Intellisense. The problem is that if your build happens to be pretty large or slow, these design-time builds can hang the Visual Studio UI with these really annoying pauses.

So, what does that have to do with references? Well, one of the uses of design-time builds is to help the project system figure out exactly what the references in a project point to. Most project references don’t specify the full path of the thing that they point at. As a result, the project system usually needs to run a design-time build so it can understand exactly where a reference is going to point once MSBuild is done with it.

Again, most of the time you never really notice this going on, it just happens quietly in the background. But there are circumstances where it can become visible, particularly when a project has unresolvable references. An unresolvable reference is, basically, a reference that the design-time build can’t find. Maybe the assembly it points at got deleted. Maybe the package it points at isn’t available on NuGet. Maybe there’s some typo in the reference itself. Whatever the reason, sometimes projects have references that cannot be resolved no matter how many design-time builds you run.

Unfortunately, this can really bite unwary Visual Studio extension developers. Because when an extension asks for the path to an unresolved reference, the project system does it’s best to try and answer that question. And how does it do it? By running a new design-time build. And if there are other unresolved references? You’ll get a design-time build for each of them. Again, if the project is small, nobody will likely notice. But if the project is large or complex? Pauses and delays.

Thankfully, there is a solution. Instead just asking for a reference’s path like this:

You can do this:

(Note that you have to switch from using the Reference type to the Reference3 type to get to the Resolved property.)

We’ve already fixed two instances of this pattern internal to Visual Studio that were causing pauses in the UI, and we’re actively looking for others. If you’re an extension author, check your code for this pattern — it may fix pauses that your users were encountering!

(We’re also adding code to the project system to recognize situations where unresolved references are never going to resolve, and skipping the design-time builds in those cases. That should help unwary extension authors, but won’t fix cases that could possible resolve but aren’t for some reason.)

You can also follow me on Twitter here.

Project Evaluations Count Too!

In my last couple of blog posts, I talked about the role that design-time builds play in Visual Studio performance. However, they are not the only way in which your project file can affect the IDE.

Before Visual Studio can do anything with your project (much less run a design-time build on it), we first have to load the project from its XML format and interpret that XML to create the in-memory representation of the project. But the MSBuild format isn’t purely static–you can specify conditions inside of the project file that governs whether other target files are imported, whether properties are set or not set, or whether items are included or not included in the build. So as MSBuild interprets the XML, it has to evaluate all those conditions to figure out what is really in the project.

And Visual Studio doesn’t only interpret your project when you open a solution, it often has to do this other times as well. For example, since a lot of things in a project file are conditioned on what build configuration (Debug vs. Retail) or platform you are building for, when you switch build configurations or platform Visual Studio may need to reevaluate the project. Or, for another example, if a project references a NuGet package that adds target files of its own, the project may need to be re-evaluated when that package is updated, in case something changed in those included target files.

Unfortunately, these evaluations aren’t necessarily free. Depending on the complexity of your project file, or of the target files it includes, it may take a little while to evaluate your entire project file. While this time is less noticeable than design-time builds in general, if you open a solution with a large number of projects it can really add up. And, unlike design-time builds, there is no cache that Visual Studio maintains of project evaluation results, so you pay the cost every time you open a project (or do something that forces a re-evaluation).

We’re thinking about ways to make this better, but in the interim we’ve been enhancing the Project System Tools extension to help users better understand the impact of evaluations. So now the Build Logging window will include evaluations as well as design-time (and regular) builds:

Right now evaluation logging only works for non-SDK projects (i.e. non-.NET Standard and non-.NET core projects) due to API limitations, but we hope to have it working for all projects very soon.

(You can also try out an experimental MSBuild evaluation profiler that’s currently sitting in a branch of MSBuild. We’re looking at moving that into the product in the near future as well.)

You can also follow me on Twitter here.

Getting Visibility into Design-Time Builds

In my last blog post, I talked about design-time builds and why you should care about them. But one of the biggest problems with design-time builds is that they are invisible. They run in the background and you don’t get any feedback that anything is going on (except, maybe, that Visual Studio seems to be a bit slower while they run). And if they fail, there’s no way to determine that that happened and no way to determine what went wrong.

To address some of these issues, the project system team has now published a new Visual Studio extension that can help: Project System Tools. This extension is a place where the project system team can add tools that make working with the project system better. The first tool that we’ve added to the extension is the Build Logging tool window. When you pull down the View menu item, under “Other Windows” there will now be a “Build Logging” choice. If you choose that you’ll see a tool window come up:

When you hit the “play” button on the toolbar, the build logging window will start recording build logs for all builds that happen in Visual Studio, including design-time builds! In the window, you’ll be able to see:

  • The project that was built
  • The type of project (csproj, vbproj, etc.)
  • The “dimensions” of the build (x86, AnyCPU, Debug, Release, etc.)
  • The top-level targets that were built
  • Whether the build was a design-time build
  • Start time and elapsed time
  • Whether build succeeded or failed (or is still running, for that matter)

The build logs are saved in the new MSBuild binary log format. If you double-click on a build log entry, we’ll try and open the binlog file using whatever viewer is registered. (I suggest installing Kirill Osenkov’s MSBuild Log Viewer) You can also right-click on the log and save it to a location of your choice, which can be handy for passing around build logs.

One thing to note is that because the Build Logging window depends on new APIs that were added to Visual Studio in the 15.4 release, you will only be able to install the extension on the most up-to-date version of Visual Studio 15 (or one of the Preview builds).

Try it out and let us know what you think! The project system tools are open source, so you can contribute to them if you go to our repo: https://github.com/dotnet/project-system-tools. We also have some more ideas of things to add, so stay tuned!

You can also follow me on Twitter here.

The Scourge of Design-Time Builds

Part of my job on the Visual Studio project system lately has been looking at the speed at which Visual Studio opens solutions containing managed language projects (such as C# and VB). As with many things, over time this common operation has gotten slower, and we would like to put some spring back in it’s step since everyone (including us!) have to open solutions all day every day.

As we’ve started to look at the various things that go on when you open a solution, one of the most obvious things we had to look at is something called design-time builds. Design-time builds are probably one of the least known and least understood things that go on in Visual Studio, and yet they often can have a real impact on how fast the Visual Studio UI responds (and not just on solution load!). I thought I’d take a minute to explain what design-time builds are and why you should care about them.

The origins of design-time builds comes from the fact that the Visual Studio build system (aka MSBuild) is not a fully declarative system. That is, you can’t just look at a .csproj file or .vbproj file and immediately understand everything you might want to know about how that project is going to build. In particular, you might not know the following:

  • Given an assembly reference in the project file, what assembly on disk is that reference going to actually refer to at compile time?
  • Given a XAML file, what is the code that is going to be generated by the XAML compiler at compile time going to look like?
  • Given a glob file pattern (*.cs), what files are actually going to be included at compile time?

And these questions aren’t just academic — if you’d like to get a nice Intellisense experience (or all the other editor enhancements that you get from the compiler), then the compiler has to be able to answer those questions before you ever get to compiling your project. If it can’t get those answers, then it can’t see all the code and assemblies that make up your project, and therefore it can’t give you help in the editor.

So, what to do? Well, obviously, if you need to know what’s going to happen in a build, why not just run it? And so you get design-time builds. Unbeknownst to most users, Visual Studio builds your projects a lot more than you think. Potentially every time you make a change to a project that will affect how the project is built, Visual Studio will fire off a design-time build in the background. Now, there are a few differences in how design-time builds work from regular builds. In particular:

  • The design-time build doesn’t actually run the C# or VB compiler because it doesn’t need to produce the actual output (i.e. dll or exe). It just needs to know how the build would be run. So instead of, say, calling csc.exe, it will just tell MSBuild to let it know what it would have asked csc.exe to compile without actually compiling it.
  • The design-time build runs a slightly different set of MSBuild targets from a regular compile. This allows skipping things that aren’t needed in a design-time build, plus it allows the project system to run some additional targets (if needed) to provide extra information that the project system might need for, say, the Solution Explorer.

Design-time builds have two obvious issues. First, if they’re slow, it’s going to slow down Visual Studio but you won’t be able to tell where the problem is coming from. For example, a common place where slow design-time builds show up is switching between configurations. If you switch a large solution, say, from Debug to Release in Visual Studio, you might notice quite a long pause in which you can’t do anything in the UI. This is usually due to the configuration change kicking off a whole bunch of design-time builds to react to the fact that things in the project now might look different under the new configuration.

The other issue is if a design-time build fails. Since the compiler and the project system rely on design-time builds to accurately understand the contents of your solution, if design-time builds fail, things might start going wrong in the Visual Studio UI. The Solution Explorer might not show all of your files, or it might show them in the wrong place. Intellisense might not show you everything available, or it might show you nothing at all. You might get weird errors in the Error List. Often these kinds of problems can be traced back to a failing design-time build. The problem, as with performance issues, is that there’s no visible indication that that’s what the problem is.

So… Design-time builds are a necessary evil that can really mess things up if they go wrong. What can we do about it? Stay tuned…

You can also follow me on Twitter here.